 Auto Alpha Advisory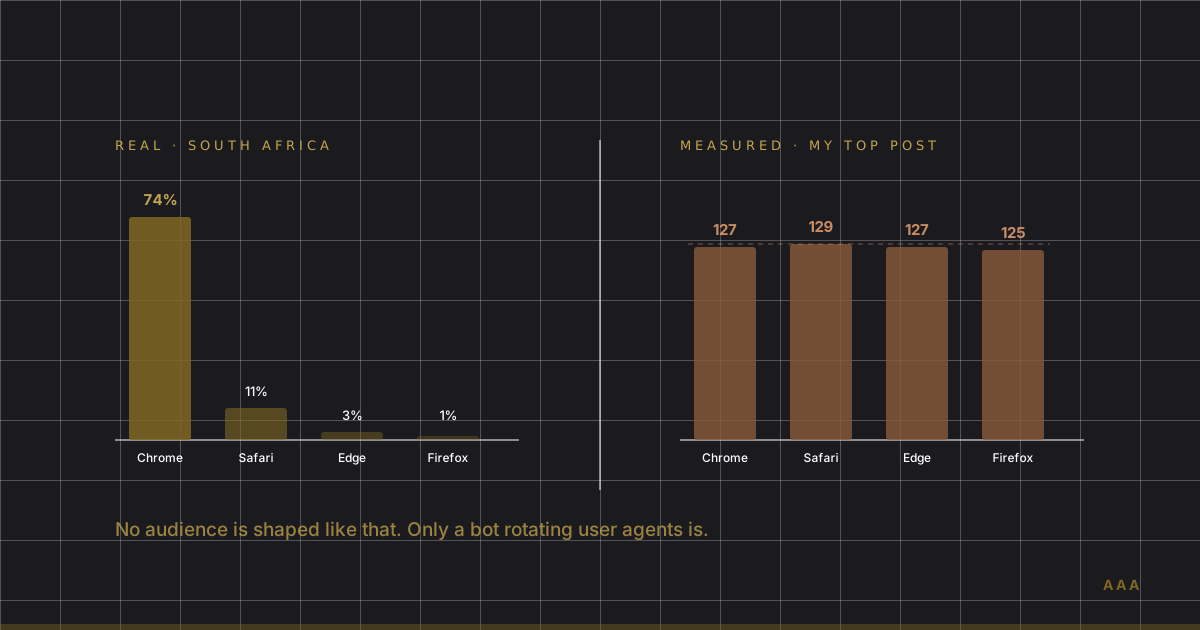
My best-performing blog post got 295 views. It was, by a wide margin, the most-read thing on my site — nearly half of all traffic the blog had ever received, most of it arriving in a two-day spike. I'd been treating it as a signal about what to write more of.
Then I opened the browser breakdown. Safari 129. Chrome 127. Edge 127. Firefox 125.
Four browsers, all within four visits of each other. That is not what an audience looks like. That is a bot farm rotating user-agent strings, and once I'd seen it I couldn't un-see it.
I'm a CA(SA) who now builds and audits websites, and I've spent a long time looking at numbers that were technically accurate and completely misleading. This is the web-analytics version, it's extremely common, and almost nobody checks for it. Here's the tell, why it works, and how to run it on your own site in about a minute.
What normal browser traffic actually looks like
The check works because real browser usage is wildly lopsided, and lopsided in a way that's public and easy to verify.
StatCounter's browser market share for South Africa in June 2026 breaks down like this: Chrome 74.34%, Safari 10.77%, Samsung Internet 7.04%, Opera 3.05%, Edge 2.8%, Firefox 1.14%.
Look at the ratio at the ends. Chrome is roughly 65 times Firefox. In any real sample of South African visitors, Chrome should tower over everything and Firefox should be a rounding error. Samsung Internet should out-perform Edge, because this is a mobile-heavy market.
Now put my numbers next to that:
| Browser | Expected (SA) | My "top post" |
|---|---|---|
| Chrome | 74.3% | 127 |
| Safari | 10.8% | 129 |
| Edge | 2.8% | 127 |
| Firefox | 1.1% | 125 |
Chrome came last. Firefox — one visitor in ninety, in the real world — matched it almost exactly. There is no audience on earth that produces that shape. The only thing that does is software cycling through a list of user-agent strings, giving each one roughly equal turns.
That's the whole check. One column, ten seconds, no tooling.
Why this is worth your attention
This isn't a quirk of my little site. Automated traffic is now the majority of the web.
Imperva's 2026 Bad Bot Report found that 53% of all web traffic in 2025 was automated, up from 51% the year before, with human traffic falling to 47%. Their framing is worth sitting with. As Imperva's Tim Chang puts it:
"Businesses are not serving customers alone. They are serving machines."
The report calls it a structural change in how the internet operates rather than a temporary spike, and the direction of travel supports that.
An honest caveat: the exact number depends heavily on who's counting and what they count. Security vendors measuring the application-layer traffic they defend report figures at or above half. Network-level measurements using narrower definitions come in lower. I'm citing Imperva's because it's a primary, dated source with a stated methodology — not because it's the highest number available. The point isn't the decimal place. It's that the share is large enough that assuming your analytics are all human is no longer a safe default.
Why Google Analytics doesn't save you from this
The obvious objection is that analytics platforms already filter bots. They do — partially, and in a way that matters here.
Google Analytics 4 automatically excludes traffic from known bots and spiders, identified using Google's own research plus the Interactive Advertising Bureau's International Spiders and Bots List. That's genuinely useful. But read Google's own documentation carefully:
"At this time, you cannot disable known bot traffic exclusion or see how much known bot traffic was excluded."
Two things follow. First, you can't audit the filter — you have no visibility into what it removed or how much. Second, and more importantly, the operative word is known. A bot that announces itself as GPTBot or AhrefsBot is on the list and gets dropped. A bot that says it's Firefox 121 on Windows is not on any list, because it's claiming to be a browser.
The traffic I found was doing exactly that. It presented as four ordinary consumer browsers and reported google.com as its referrer — 479 times on that one post. A referrer string is just a header. Anything can claim anything.
That's why the distribution check beats the filter. You're not asking "does this visitor admit to being a bot," which any determined bot will lie about. You're asking "does this population have the shape a human population has," which is much harder to fake and which nobody bothers faking, because almost nobody looks.
How to run the check on your own site
Five minutes, whatever analytics you use.
1. Pull the browser breakdown for the longest window you have. Not the last week — you want enough volume for a shape to emerge.
2. Compare it to StatCounter for your actual market. For South Africa that's Chrome dominant at roughly three-quarters, everything else in single digits. If your top four browsers are within a few percent of each other, stop and investigate. Real distributions are steep.
3. Check the operating-system column too. Mine read Windows 133, Android 113, macOS 108, iOS 107 — the same suspicious flatness. Two independent columns agreeing is close to conclusive.
4. Segment your suspected spike separately from your quiet baseline. This is the step people skip, and it's the one that changes decisions. My 24–25 June spike showed Firefox 70, Safari 70, Edge 64, Chrome 47. My quiet fortnight after that showed Chrome 13, Edge 5, iOS 1 — a small sample, but a normally shaped one. Same site, same tracking, two completely different populations. Averaging them together would have hidden both facts.
5. Sanity-check geography and bounce rate. Mine was 273 United States against 87 South Africa on a site selling South African services, at an 86% bounce rate. On its own that proves nothing. Alongside a flat browser split, it's corroboration.
If you'd rather not do this by hand, a free scan reads nine domains of your site including how machines actually interact with it — but the browser-column check costs nothing and you can do it before you finish this paragraph.
What to do once you've found it
Less than you'd think, and that's the point.
Don't rush to block anything. Not all automated traffic is hostile, and some of it is now commercially essential. The search crawlers behind ChatGPT, Claude and Perplexity have to read your site for your own pages to be cited in AI answers — and a Vercel and MERJ study confirmed that AI crawlers fetch raw HTML without executing JavaScript. Blocking indiscriminately is how businesses accidentally make themselves invisible to the assistants their customers are asking. I've found real South African companies doing precisely that without knowing.
Do exclude yourself. Your own visits inflate everything, especially on a low-traffic site. Most platforms support this; it took me one line in the browser console.
Do re-read your decisions. This is the actual cost. I had been treating that post as evidence of what my audience wanted. It was evidence of what a scraper wanted. Any content plan, ad spend or redesign priority built on inflated numbers is built on nothing, and the error compounds quietly because the numbers keep looking healthy.
Do keep the real baseline visible. Once I separated the spike out, my genuine traffic was about two human visitors a day. That's a much less pleasant number and a far more useful one, because it points at a real problem — distribution — instead of a fake success.
How do I know if my website traffic is real
Compare your browser breakdown against StatCounter for your country. Real traffic is steeply lopsided — in South Africa, Chrome is about 74% and Firefox about 1%. If your top browsers sit within a few percentage points of each other, the traffic is almost certainly automated. Check the OS column as a second opinion.
Does Google Analytics filter out bot traffic
Partially. GA4 automatically excludes known bots using the IAB Spiders and Bots list, and you cannot switch it off or see what it removed. It does not catch bots that disguise themselves as ordinary browsers, which is what sophisticated scrapers do. Automatic filtering is a floor, not a guarantee.
Is bot traffic bad for my website
Not automatically. AI and search crawlers need to read your site for you to appear in answers and results. The harm is mostly decisional — inflated numbers lead to wrong conclusions about what's working. Scraping at volume can also cost you bandwidth and skew conversion rates, since bots never convert.
Should I block bots from my website in South Africa
Be careful. Blocking indiscriminately is how sites become invisible to ChatGPT, Claude and Perplexity, whose crawlers must fetch your pages for you to be cited. Identify which bots you're blocking before you block anything, and verify by fetching your own site as each crawler to see what comes back.
The part that matters
The uncomfortable thing about analytics is that they never look broken. Mine reported real page views, from real-looking browsers, in real countries, with plausible referrers. Every individual number was accurately recorded. The dashboard was doing its job perfectly.
What it couldn't tell me was that the population it was describing wasn't people. That judgement needed someone to look at the shape of the data rather than its totals — and shape is exactly what a dashboard optimised for totals will never show you.
It's the same failure I wrote about when 126 automated checks passed on a site whose headings were invisible: the measurements were all correct, and the conclusion they supported was all wrong. Numbers confirm what's present. They don't tell you whether it's real.
Ten seconds on one column would have saved me weeks of believing a story my own analytics were telling me. Run my free scan if you want an honest read on what's actually reaching your site — nine domains, scored, weak results shown rather than smoothed. Or book a discovery call and we'll look at your numbers together.
Sources · 5
- StatCounter — Browser Market Share South Africa, June 2026 — Chrome 74.34%, Safari 10.77%, Samsung Internet 7.04%, Opera 3.05%, Edge 2.8%, Firefox 1.14%
- Imperva — 2026 Bad Bot Report: Bots in the Agentic Age — 53% of web traffic automated in 2025, up from 51% in 2024; human traffic 47%
- Google Analytics Help — Bot traffic exclusion — known bots excluded automatically via the IAB International Spiders and Bots List; cannot be disabled or inspected
- Vercel / MERJ — How AI crawlers interact with the web — GPTBot, ClaudeBot and PerplexityBot fetch raw HTML and do not execute JavaScript
- Imperva — Bad Bot Report resource library — annual methodology and prior editions